
Run your consultancy from one place.
Bitmap connects your consultancy from the first client conversation to the paid invoice. Clients, contracts, projects and budgets in one place. A clear view of who’s busy and who’s available. Timesheets on time. Invoices raised automatically, on schedule. And numbers that add up, because they all come from the same source.
A consultancy runs on a few numbers.
How much of the team is billable this month. How much of each budget is left. Who is free in three weeks. What has been invoiced, what has not, and what has been paid for but not yet delivered. Most firms know these numbers. The trouble is where they keep them.
The numbers live in too many places
Timesheets in one tool, the plan in a spreadsheet, budgets in a proposal somebody wrote, invoices in the accounts package. Every number is right somewhere and none of them agree.
Somebody rebuilds them every month
Month-end means an operations lead or a director pulling exports into a workbook and reconciling them by hand. It takes days, it is late, and it is wrong in a way nobody finds until the next month.
So decisions wait for the spreadsheet
Can we take the project on? Is that budget in trouble? Should we hire? The answer exists, but it is a week of work away, so the decision gets made on a feeling instead.
The numbers agree when they come from one place.
In Bitmap a budget is the same record the timesheet is logged against, the planner books time against and the invoice is raised from. Utilisation, budget burn, availability and deferred income are not reports somebody assembles. They are what the data already says.
See who is on what, and who is free.
The resource planner puts people down the side and weeks across the top. Book a person onto a budget for a run of days and the plan, the forecast and the availability report all change together. Try a scenario before you commit to it. When somebody logs the time, the planned block gives way to the real one, so the plan never counts a day twice.

Timesheets that arrive on time.
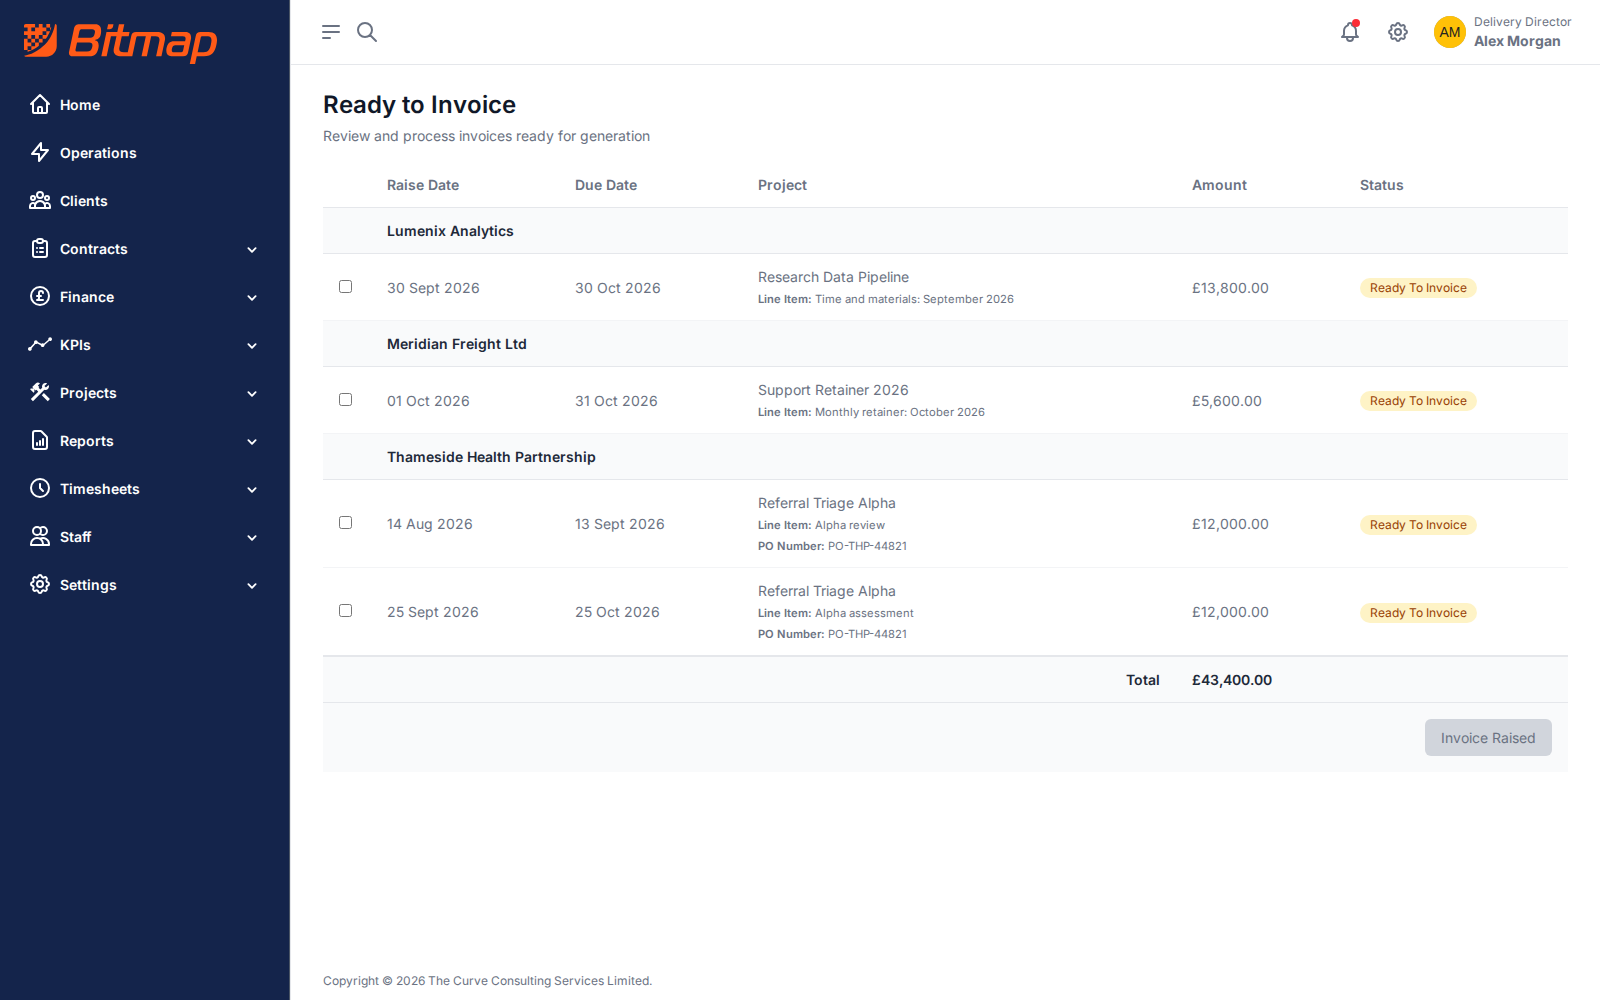
A person logs a day against a project budget in a few clicks, from the plan of the day they already have. An approver sees what is waiting and approves it in one place. The people whose timesheet is late hear about it in Slack, from Bitmap, so nobody has to chase.
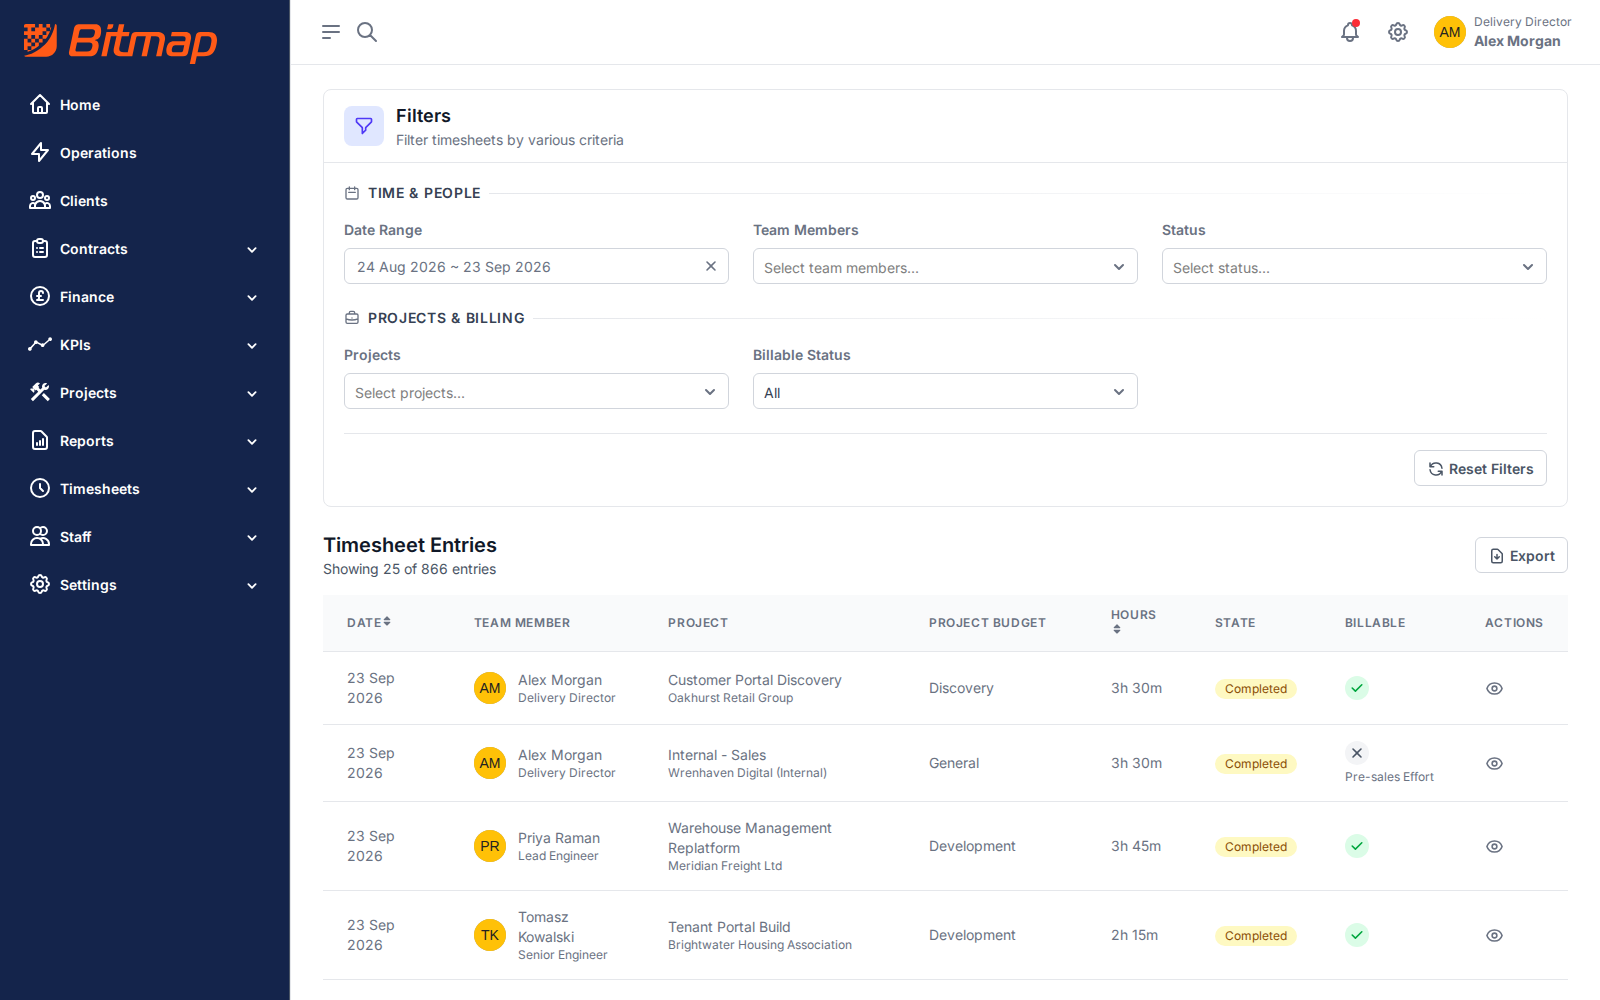
Invoices that raise themselves on schedule.
Every project carries a payment schedule: the deposit, the milestones, the monthly retainer. When a schedule falls due it appears in Ready to Invoice with the amount already worked out. Raise it by hand, or let Bitmap create the draft in Xero and follow it through to paid.
Three ways firms start.
Most arrive with a spreadsheet that has stopped scaling, a project that went over budget without warning, or a month-end that takes a week. The product is the same in every case. What differs is which problem you fix first.
A day-rate consultancy that has outgrown its spreadsheet
You sell days, and you know roughly who is on what. The spreadsheet that holds it has stopped scaling, and month-end proves it.
- Budgets, plan and timesheets against the same records
- Who is free, and when, without asking around
- Utilisation on the first of the month, not the fifteenth
An agency running retainers and fixed-price work
You sell fixed prices, monthly retainers and managed services as well as days. Each is priced, delivered and invoiced differently, and no tool you have shows them side by side.
- Contract types for how the work is actually sold
- Payment schedules that raise themselves on the milestone or the month
- Which engagements make money, and which are subsidised
A finance team that wants month-end to take an afternoon
Month-end is a reconciliation across timesheets, proposals and the accounts package, and deferred income is a number nobody can produce on demand.
- Invoices fall due on their own and raise into Xero
- Deferred income at any date, per project and in total
- The board figures on the first, from the same records
From a signed contract to a paid invoice, with the numbers agreeing all the way.
Bitmap follows the shape of the work a consultancy already does. Nobody has to learn a new way to run the business, only a new place to keep it.
-
1
Sell
A client, a contract and a project with budgets: days or a fixed sum, at the rates on your rate card, with the payment schedule agreed up front.
-
2
Plan
Book people onto the budgets in the planner. Availability, the forecast and the deferred income position update as you go.
-
3
Deliver
People log time against the budgets they are booked on. Approvers approve. Health checks flag the project that is burning faster than it should.
-
4
Bill
Payment schedules fall due and land in Ready to Invoice. Raise the invoice, in Bitmap or in Xero, and watch it through to paid.
Everything the screens do is also a JSON API behind the same login, with OAuth for the tools you connect to it. The Google Slides add-on that puts Bitmap charts in a board pack is built on it.
The numbers your board asks for, already there.
Utilisation, deferred income, non-billable time and project health are computed from the timesheets, the budgets and the invoices as they are entered. Nobody builds the board pack any more; they open it.
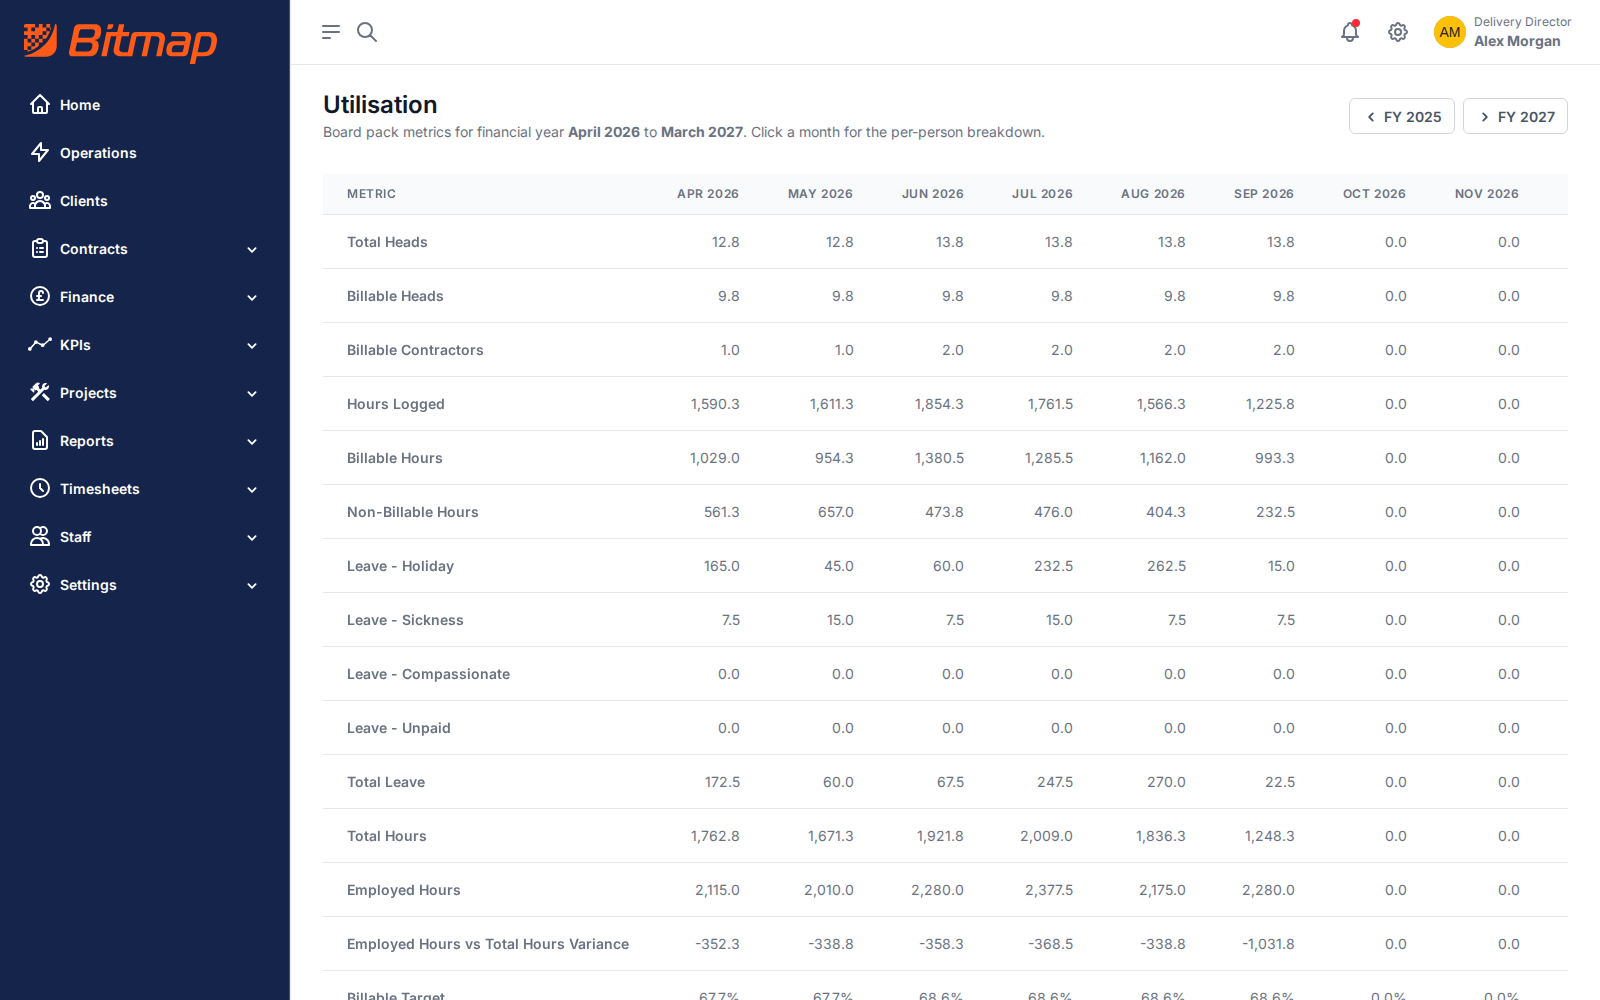
Billable and non-billable hours per person and per month, against target, across the year.
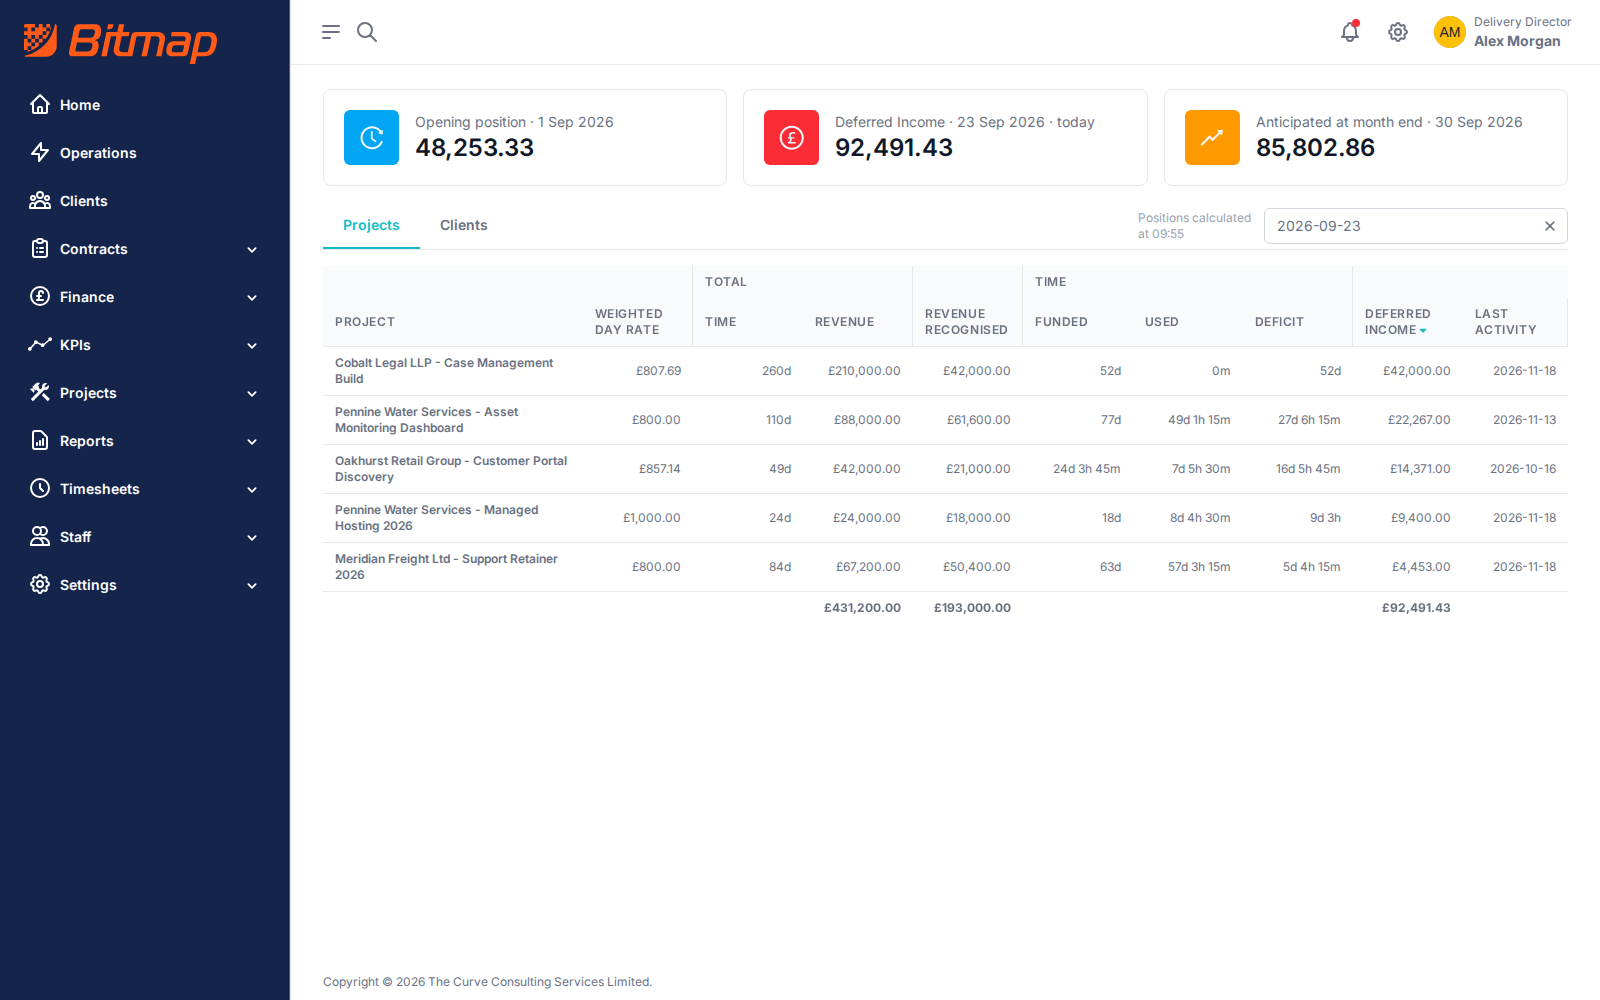
What has been invoiced but not yet delivered, per project and in total, today and at any date you pick.
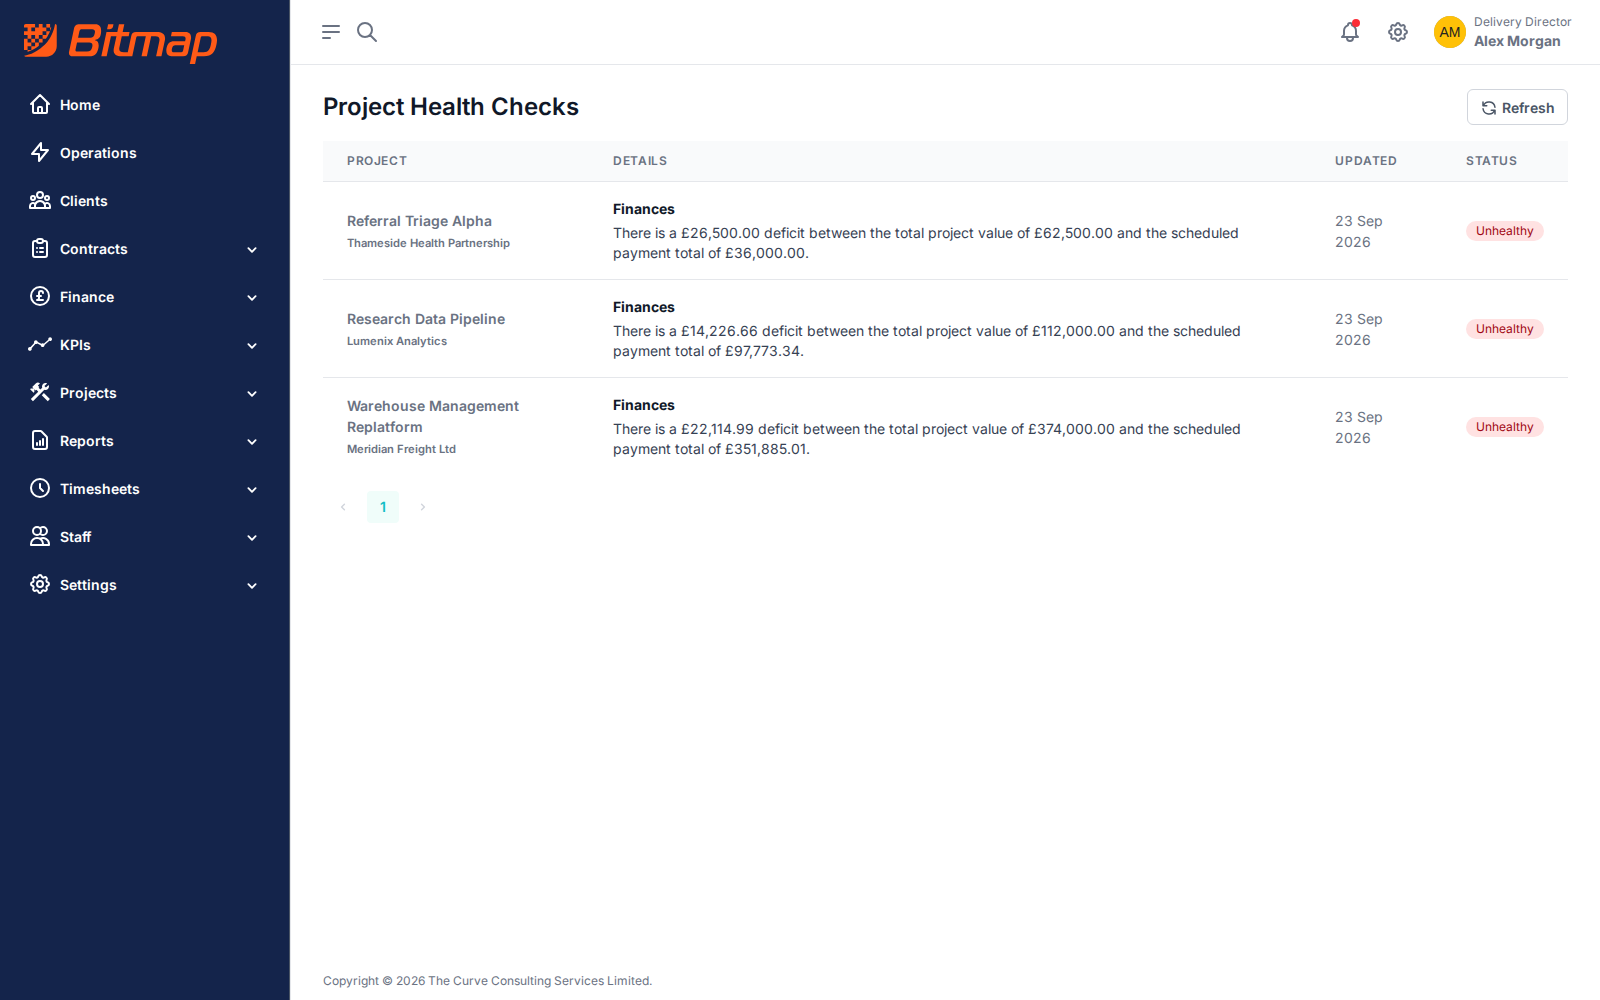
Every active project against the finance, overage and timesheet checks, with the reason behind each status.
See your own consultancy in it.
Start a free trial and bring your clients, your projects and your team. Or book a demo and we will walk through it with you.